The Photographer’s Guide to Histograms: From Basics to Mastery
t some point in every photographer’s journey, you realize that the tiny screen on the back of your camera can’t always be trusted. In bright sunlight, that perfect shot may turn out too dark. In low light, it may look brighter than it really is. That’s where the histogram comes in—a powerful, objective tool that tells you exactly what’s happening with your exposure.
This isn’t just beginner advice. Even seasoned pros rely on histograms to nail exposure in challenging situations. Let’s dig deeper into what the histogram really tells us, how to use it in the field, and the advanced techniques that separate casual shooters from those in full control of their images.
1. What Exactly Is a Histogram?
At its core, a histogram is a graph showing the distribution of brightness values in your photo. Each digital image is made up of pixels, and each pixel has a brightness value from 0 to 255:
0 = Pure black (far left of the histogram)
128 = Middle gray (center of the histogram)
255 = Pure white (far right of the histogram)
Every bar in the histogram shows how many pixels in your image fall into one of those 256 tonal “buckets.” A tall spike at 0 means lots of black pixels. A tall spike at 255 means lots of white pixels. Everything else falls in between.
Important distinction: the histogram doesn’t care about subject matter or composition—it only tells you about exposure and tonal distribution in numeric form.
2. Luminance vs. RGB Histograms
Most cameras offer two main types:
Luminance Histogram: Shows brightness values on the 0–255 scale without regard to color.
RGB Histogram: Breaks down exposure into Red, Green, and Blue channels, each with their own 0–255 scale.
Why does this matter? Because clipping can occur in one channel before it shows up in the overall luminance histogram. Example: a sunset may look fine overall, but the red channel could be pushed to 255 while the others still have room. That means you’ve lost subtle gradations in the reds. This scenario is visible in the example below. This unedited RAW image was taken to control as much clipping as possible while still retaining enough balance in the scene overall to bring back detail in the shadows.
3. What Histograms Can Reveal
Balanced exposures: Data spread across the full 0–255 range, without bunching at either extreme.
High-key images: Data clustered toward 200–255.
Low-key images: Data clustered toward 0–50.
Clipping indicators:
Left edge (0) = Shadow detail may be lost.
Right edge (255) = Highlight detail may be lost.
4. The Nuance of RAW vs. JPEG Histograms
One thing that often surprises photographers is that the histogram you see in-camera is not generated from your RAW file — even if you are shooting RAW. Instead, it’s based on the JPEG preview your camera creates, which is dictated by your current JPEG settings in-camera (such as picture style, contrast, and saturation).
Why This Matters
JPEGs are compressed: They have less tonal range and dynamic range compared to RAW.
RAW files hold more data: When you shoot RAW, your sensor captures additional highlight and shadow detail that isn’t reflected in the JPEG-based histogram.
Picture styles affect the histogram: A high-contrast JPEG profile will exaggerate clipping. A flat/neutral profile will give you a histogram closer to your RAW file’s true potential.
The Practical Effect
Apparent clipping may not be final: Your camera’s histogram might show highlights blown out to 255 or shadows crushed to 0, but when you bring the RAW file into Lightroom or another editor, you often discover there’s still recoverable detail.
JPEG shooters have less latitude: If you only shoot JPEG, what the histogram shows is almost exactly what you’ll get. Recovery options in post are very limited.
RAW shooters get a buffer: Depending on your camera’s sensor, you might have as much as an extra stop (or more) of recoverable highlight or shadow detail beyond what the histogram suggests.
Practical Tips
Don’t panic if your histogram shows some clipping when shooting RAW — it might be salvageable.
Still, don’t rely too heavily on recovery. Pushing RAW files too far in post can introduce noise (in shadows) or strange color shifts (in highlights).
For a more accurate RAW histogram, set your camera to a flat or neutral JPEG picture profile. This reduces the chance of false clipping warnings from an overly contrasty preview.
5. Understanding Clipped Highlights and Crushed Shadows
One of the most important reasons to use histograms is to avoid clipping highlights or crushing shadows. These terms describe what happens when parts of your image exceed the limits of the 0–255 tonal scale.
Clipped Highlights (Data Lost at the Top End)
What it means: Pixels that should contain detail in bright areas (like clouds, wedding dresses, or reflective water) are forced to 255 (pure white). Once this happens, those areas no longer contain any texture or information — they are just flat white.
Why it matters: In post-processing, no amount of highlight recovery can bring back texture in those clipped areas. If your sky is blown out, it stays blown out.
How to spot it: In the histogram, data will be bunched up against the right edge at 255. On-camera, you may also see “blinkies” (flashing highlight warnings) in those areas.
When it’s acceptable: Sometimes, it’s okay to clip small highlight areas, like specular reflections on water or bright streetlights. These are naturally pure white in reality. But clipping large areas usually looks unnatural.
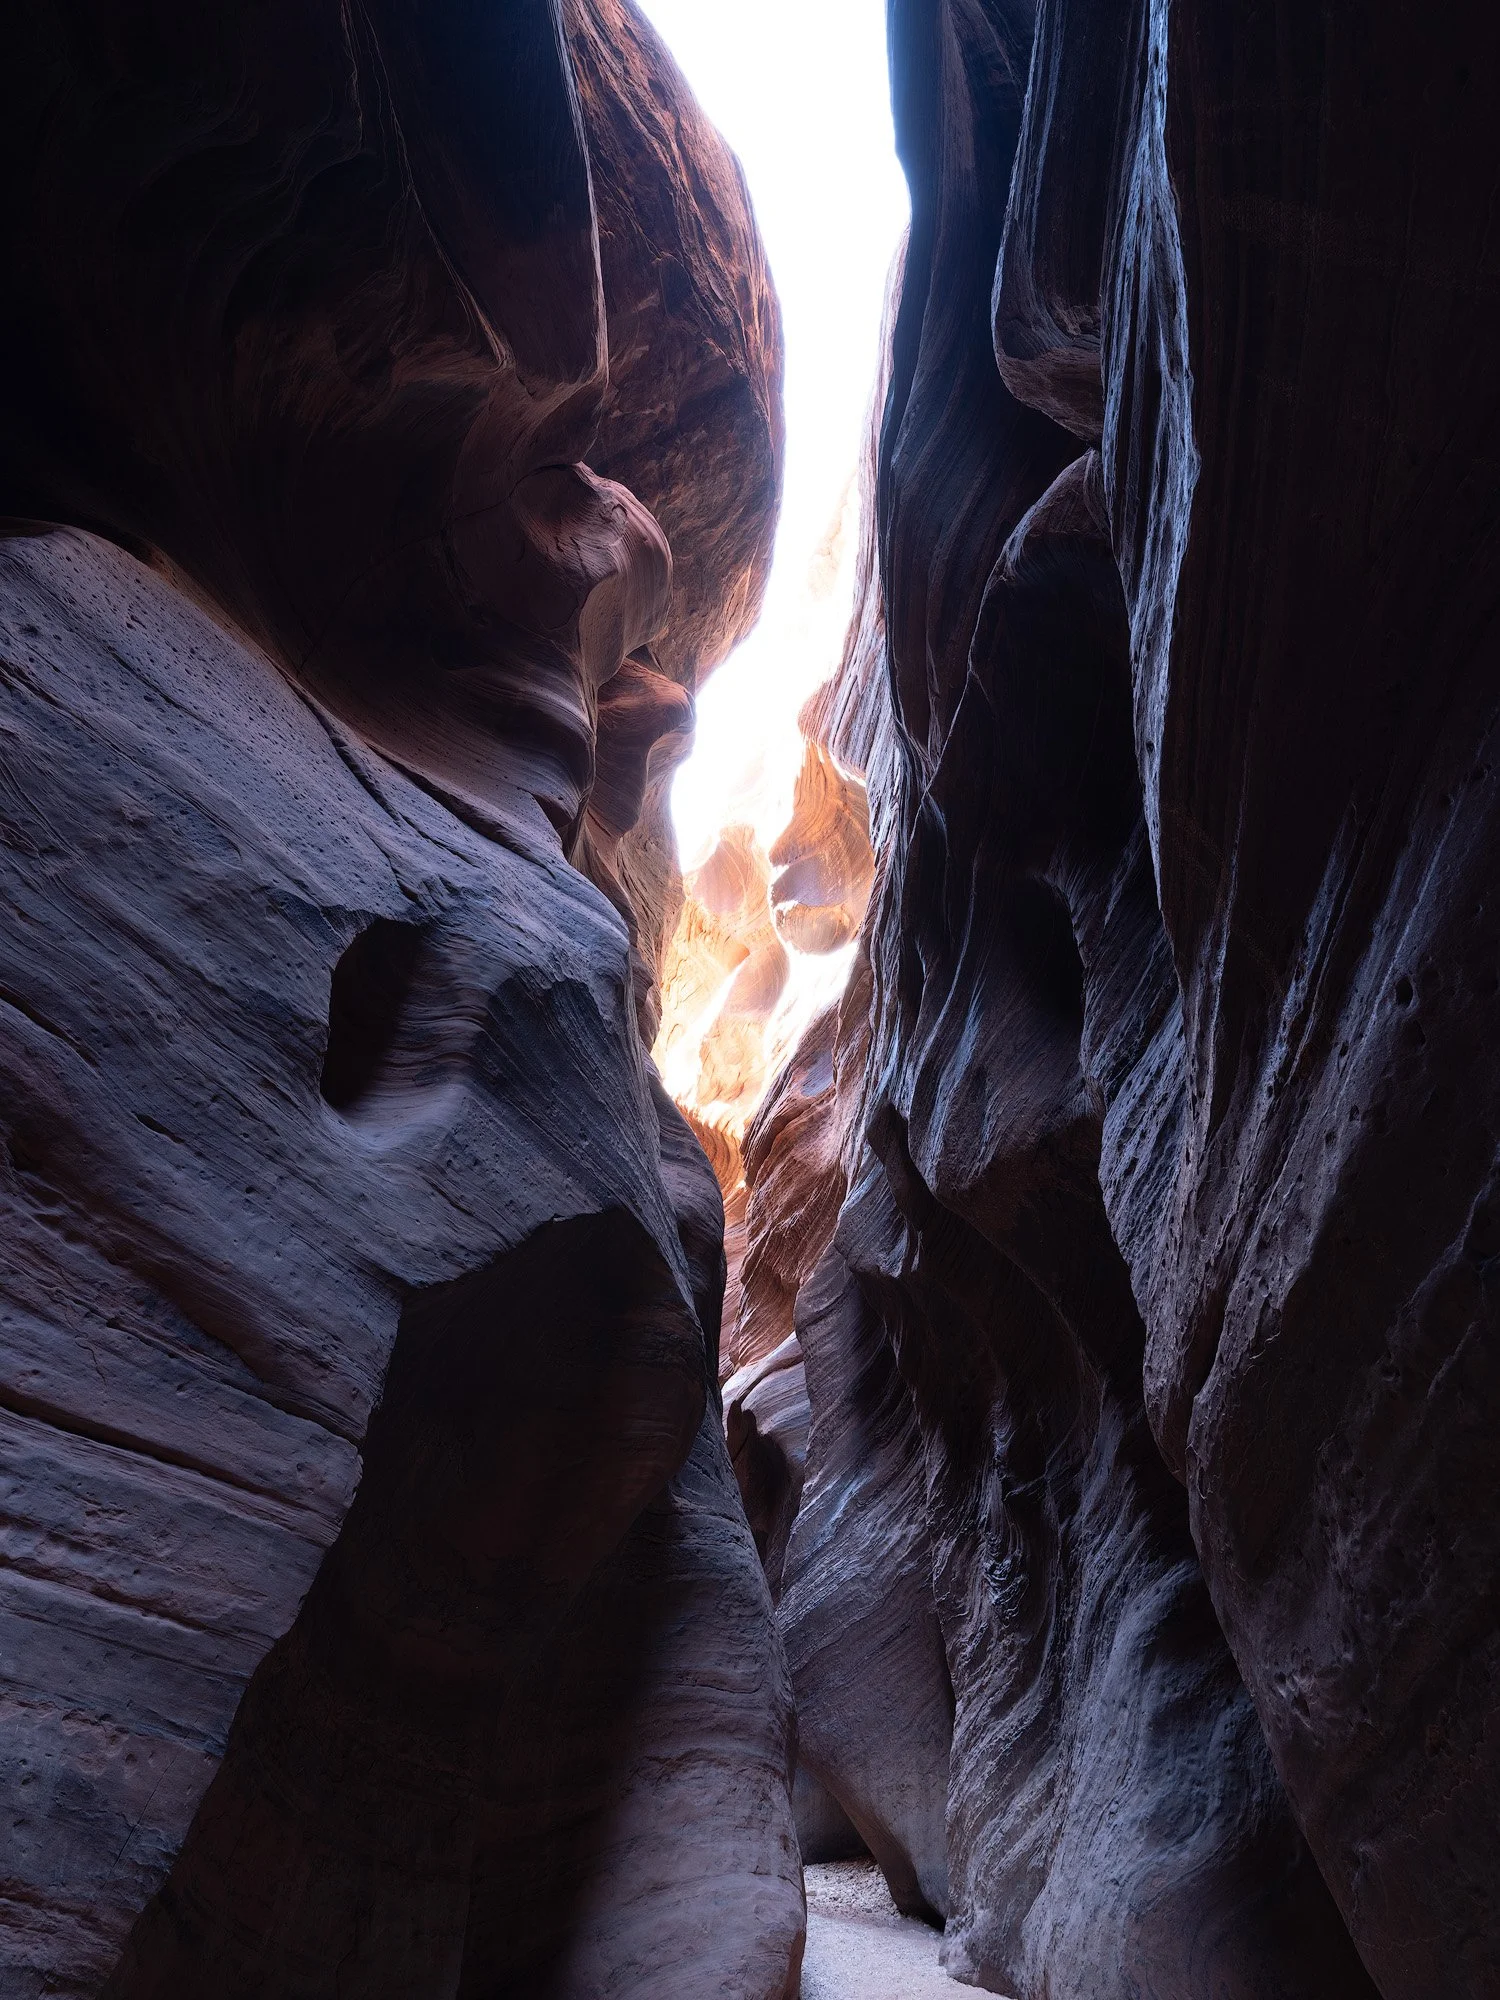

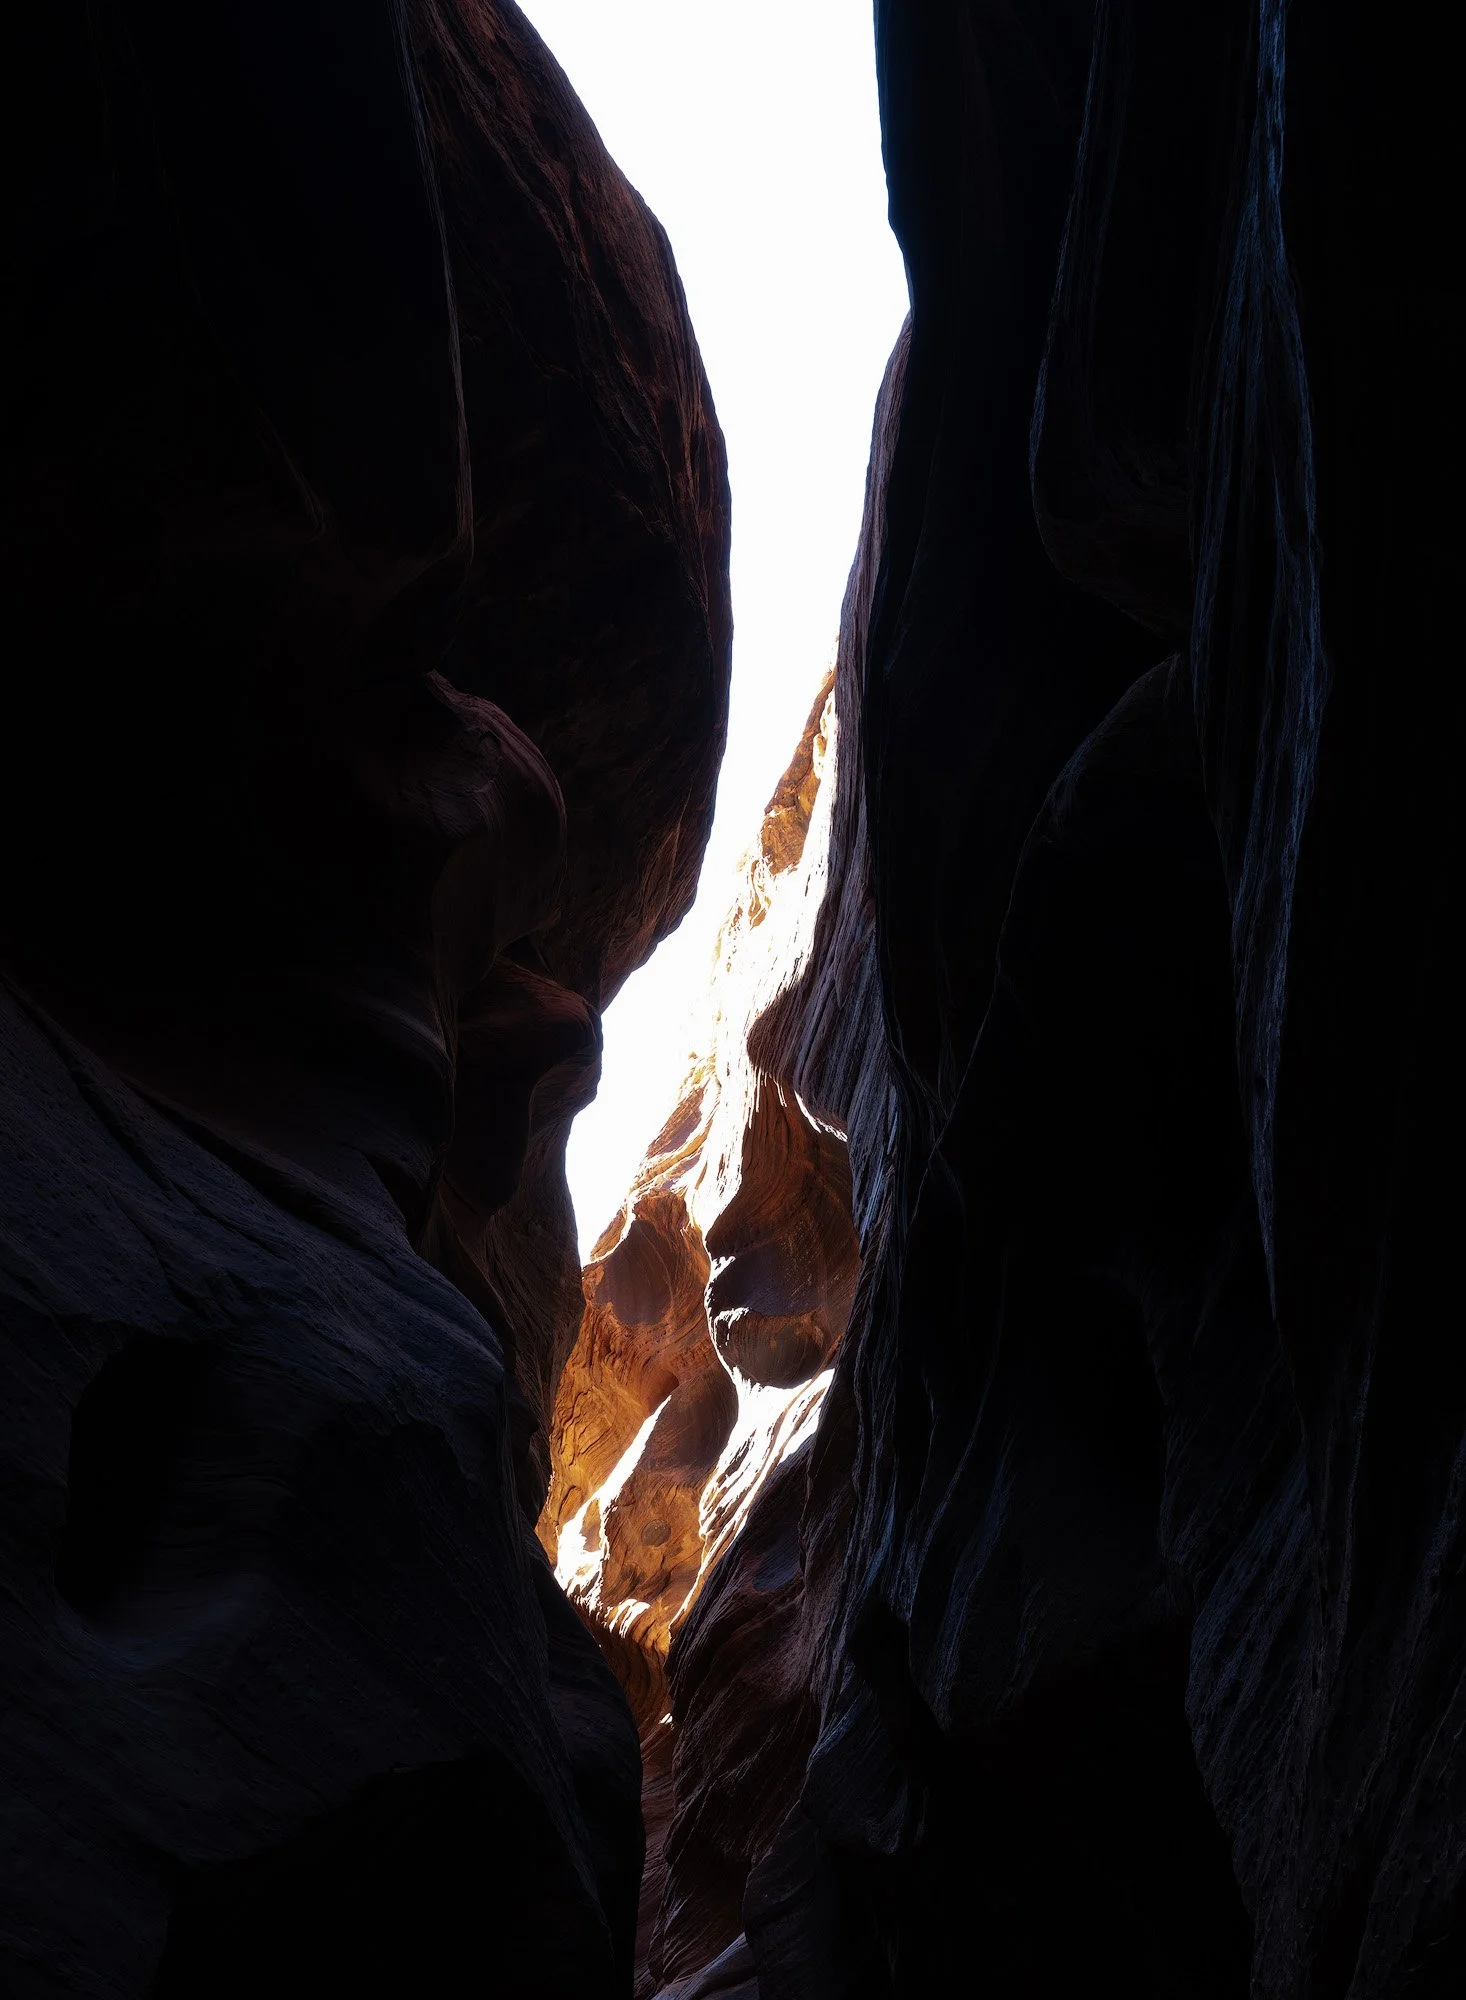
In the gallery above, the first photo is an unedited RAW photo taken in Buckskin Gulch. The scene’s dynamic range exceeds the capabilities of the camera being used (Fuji GFX 100S). The middle image shows highlights that are being clipped in red. The third image is what the clipped area looks like after decreasing exposure in post production by 3 stops. Data in that part of the image is unrecoverable.
Crushed Shadows (Data Lost at the Bottom End)
What it means: Dark areas of the photo are pushed down to 0 (pure black), eliminating subtle tonal differences. Instead of textured shadows, you get flat black “blobs.”
Why it matters: While our eyes can adjust to darkness and still perceive texture, the camera sensor may not record it if everything is clipped to black. In editing, lifting shadows that are already at 0 introduces noise without recovering lost detail.
How to spot it: In the histogram, data will be piled up against the left edge at 0. You might also notice areas of the image where nothing is distinguishable — just a solid black patch.
When it’s acceptable: In high-contrast or artistic shots, deep blacks can add drama. Crushed shadows are often used intentionally in film noir or silhouette photography. The key is whether the loss supports your vision.

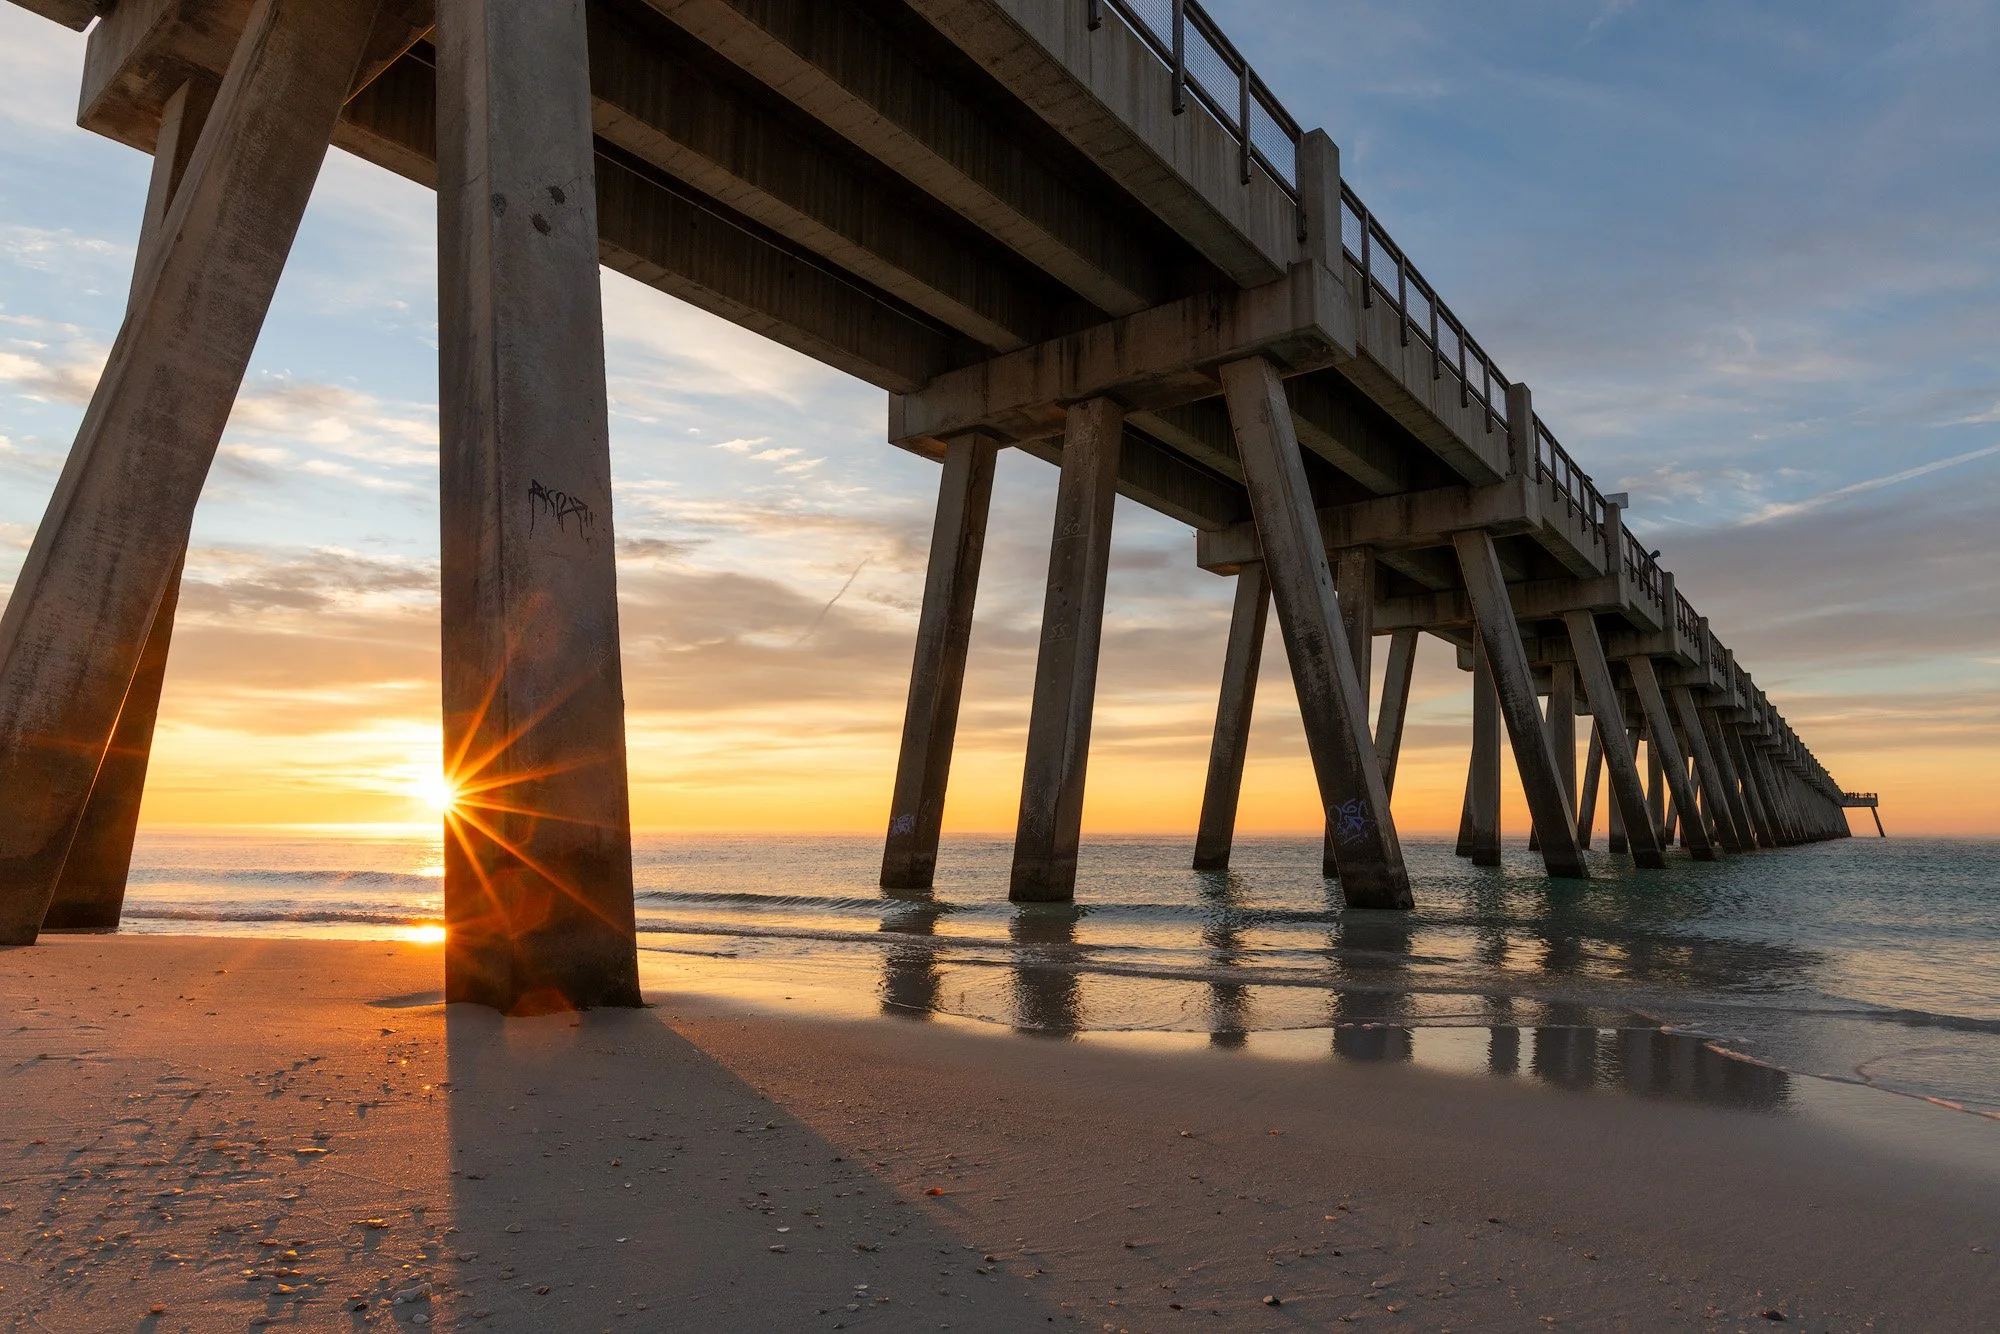
In the above examples the photo was taken to preserve the highlights from the sunrise. In doing so, I compromised shadow detail, as evidenced by the histogram data. Most shadow detail was recovered in post, but at a little bit of a sacrifice. A full resolution shot would show less detail being recovered from the darkest shadows. The darkest shadows of the pier will never have adequate detail because that information was lost at the time of capture.
Balancing Act
Digital sensors favor shadows: Modern sensors often capture more recoverable data in shadows than in highlights. That’s why many photographers recommend protecting highlights even if it means deeper shadows.
Clipping vs. crushing isn’t always bad: The goal isn’t to avoid touching 0 or 255 entirely. It’s to make sure you don’t lose important information. A night sky should have areas at 0. A shiny reflection might blow out to 255. But if your subject’s face is stuck at either extreme, that’s a problem.
6. How to Use Histograms in the Field
Histograms aren’t just for reviewing your shots — they’re a tool for actively guiding your exposure decisions in the moment. Here are three practical ways to apply them:
Expose for the Highlights
Digital sensors generally record more recoverable information in shadows than in highlights. Once pixels hit 255 (pure white), that detail is gone forever. It’s often safer to let shadows fall a little deeper (even down toward 0) than to risk blowing out bright areas like skies, clothing, or reflective surfaces.
ETTR (Expose To The Right)
One of the most widely used histogram-based techniques is ETTR, short for Expose To The Right.
The idea: Push your exposure so that the bulk of your histogram data leans toward the right side (brighter tones) without actually clipping highlights at 255.
Why it works:
Digital sensors capture more tonal data in the brighter end of the exposure range. By shifting your exposure rightward, you maximize the amount of usable data recorded.
This leads to cleaner files with less noise — especially in the shadows, which can be brightened later in post-processing without falling apart.
How to do it:
Take a test shot.
Check the histogram — is there empty space between the right edge and your data?
Increase exposure (slower shutter, wider aperture, or higher ISO) until the data nearly touches the right edge, but doesn’t spike against it.
In post, bring the exposure back down to taste while enjoying smoother shadows and less visible noise.
When it’s best:
Shooting in RAW, since JPEGs don’t have the same recovery latitude.
Static or slower-moving scenes, like landscapes, architecture, and studio work.
Situations where dynamic range is manageable (not extreme contrast).
When it’s risky:
Scenes with rapidly changing light (action, street, events) — you may accidentally clip highlights before you can adjust.
High-contrast situations where the histogram is already “pushed” across the full 0–255 range.
Think of ETTR as collecting more light data up front, then sculpting it in post for optimal quality.
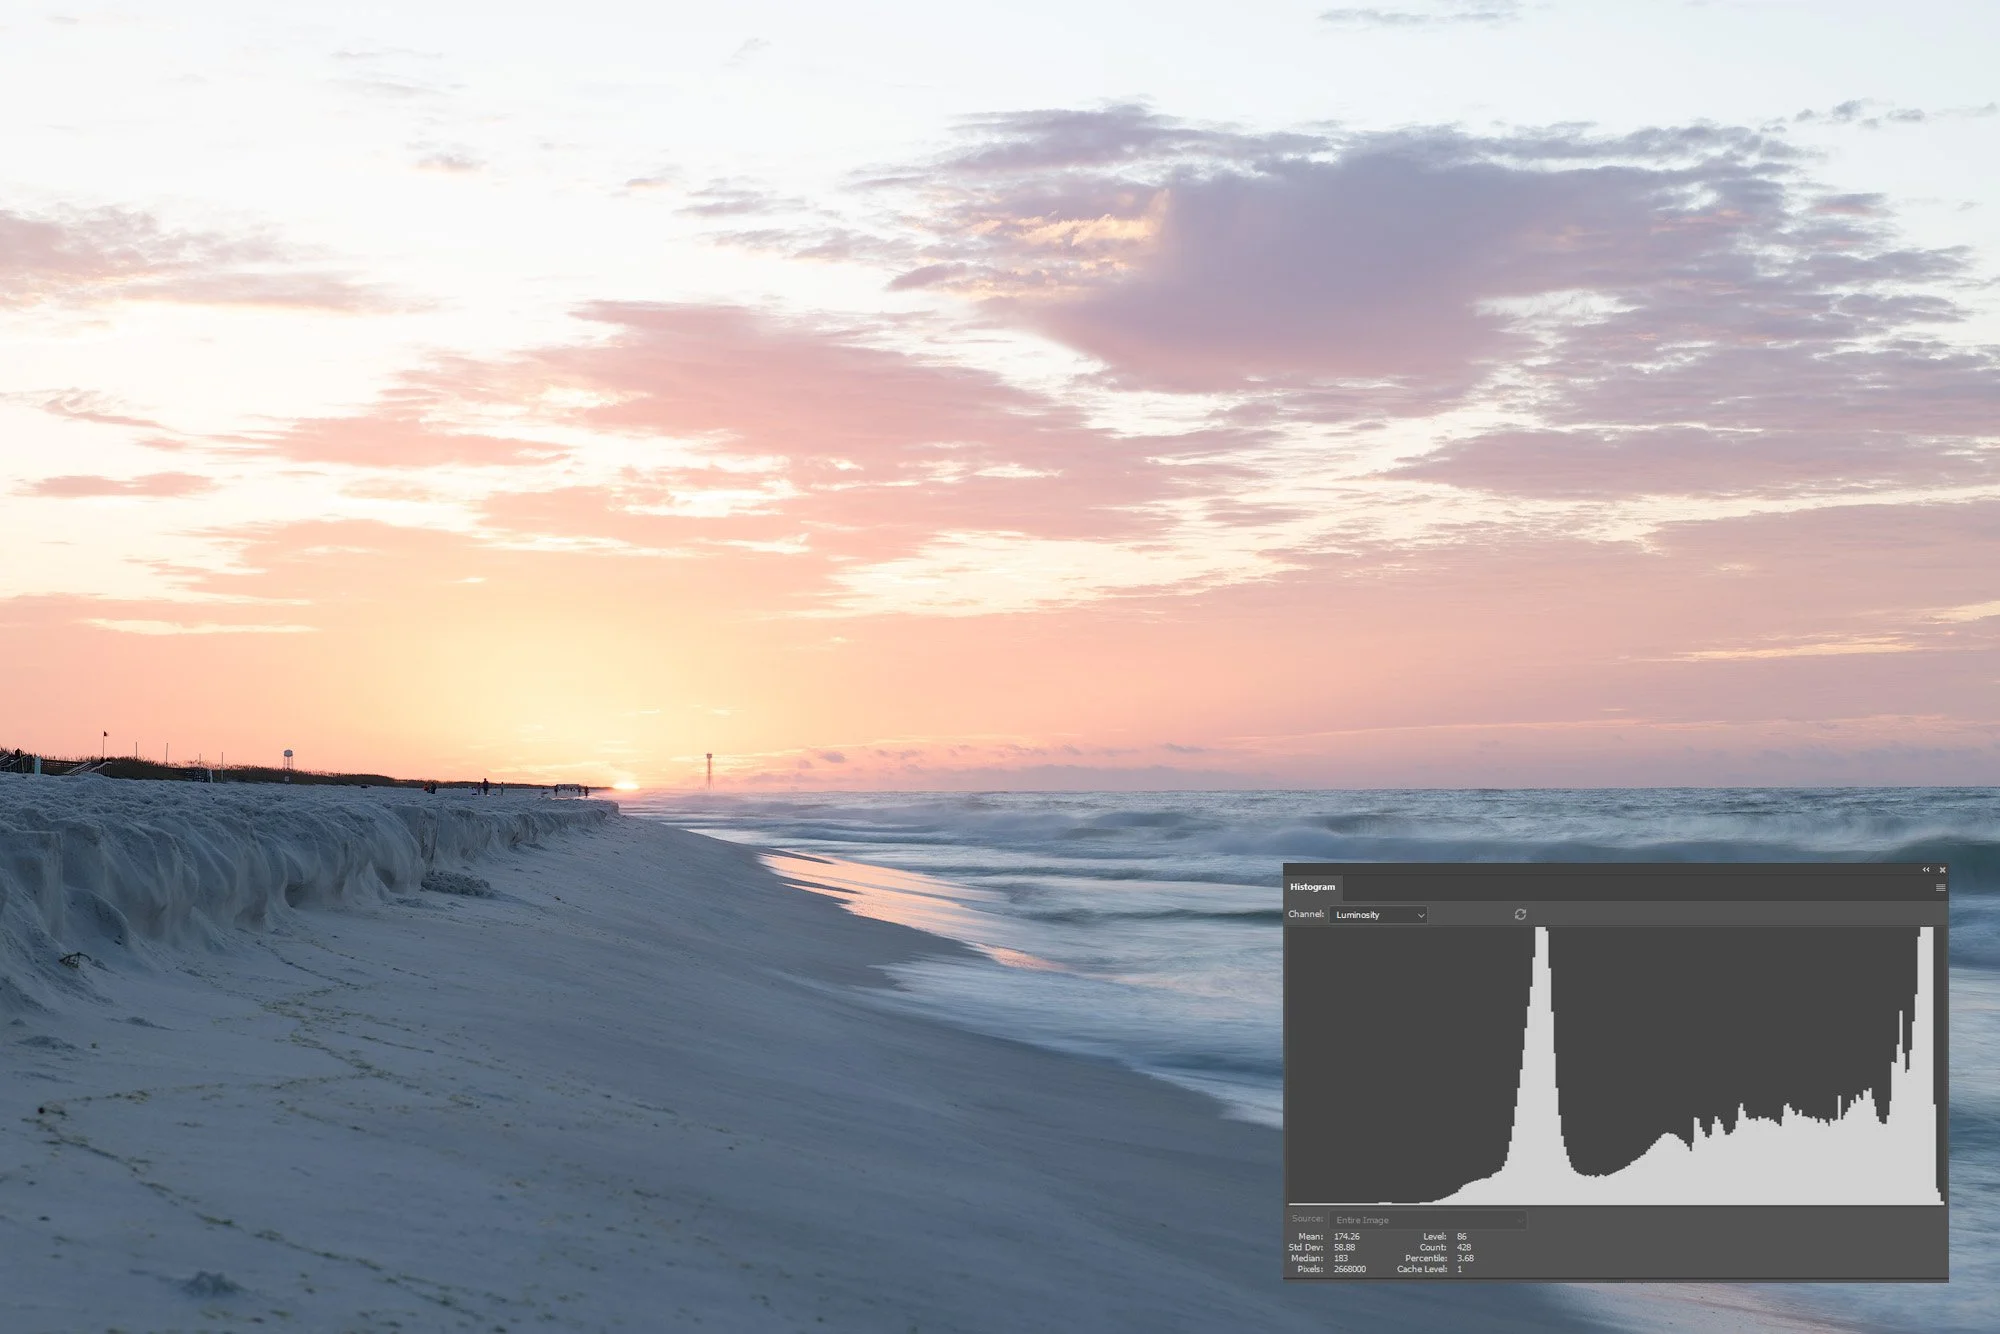

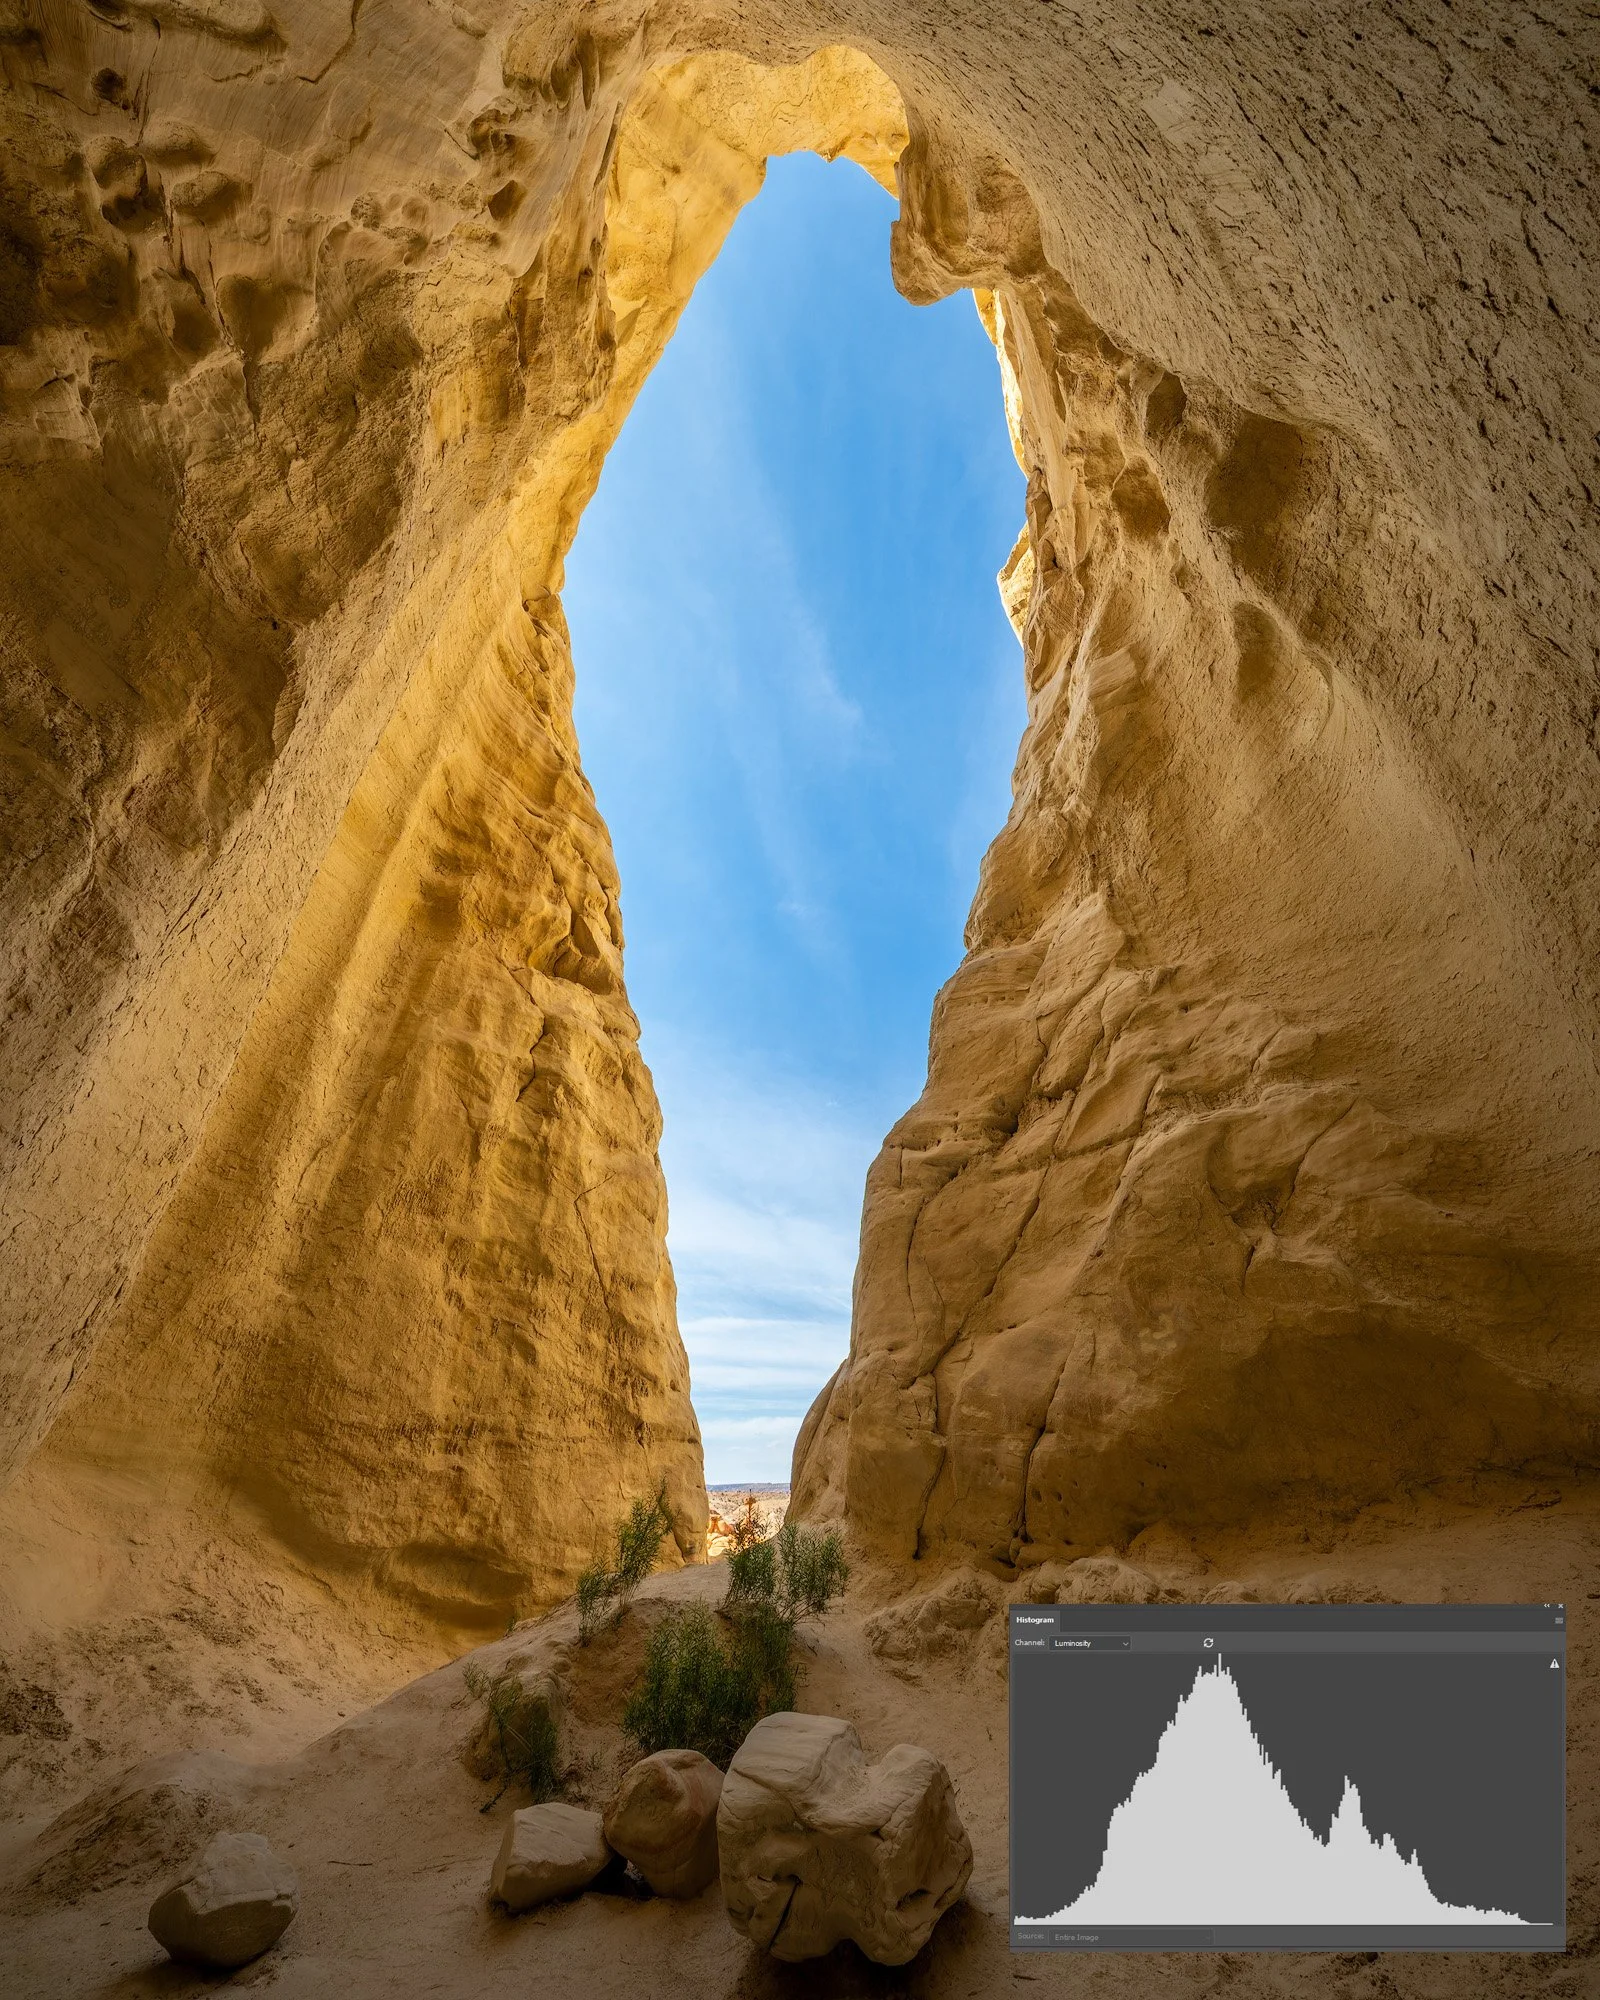
In the example above I wanted to retain as much clean detail in the foreground sand as possible. By exposing to the right I was able to capture the sunrise whil still maintaing the cleanest outcome possible for the shadow areas without needing a second exposure to blend or rely on denoising software.
Bracketing for High-Contrast Scenes
Sometimes a single exposure can’t cover the full tonal range of a scene (bright sky + dark foreground, for example). In those cases:
Use the histogram to confirm your highlights and shadows both extend beyond the 0–255 range.
Capture a series of exposures (usually one exposed for highlights, one for midtones, one for shadows).
Blend them later (HDR or exposure blending) for a balanced final image.
My preferred approach is to start with a base exposure as if I were only taking one shot. This ensures that my “main” photo is strong enough to stand on its own and isn’t overly dependent on the other exposures. The additional bracketed frames then serve as support, filling in missing highlight or shadow detail if needed, rather than being the foundation of the final image.
The photo below was difficult to capture in one shot due to the extreme difference between highlights and shadows. I shot one photo exposed for the sky and another exposed for the shadows. A simple edit merging the two photos resulted in a more balanced exposure which looks like what I saw in person.


8. The Limits of Histograms
Histograms are powerful tools, but they’re not perfect. Understanding their limitations is just as important as knowing how to use them.
Global vs. Local Information
The histogram is a summary of the entire image. It can tell you that pixels are being clipped at 255, but not where in the frame that’s happening. For example, a bright streetlamp in the corner might blow out, while the rest of the scene is fine — yet the histogram will show a highlight spike. This is why pairing the histogram with “blinkies” or highlight warnings is so effective: together, they give you both the big picture and the precise location of the issue.JPEG-Based Preview
The histogram you see in-camera is built from the JPEG preview, not directly from the RAW file. That means it may show clipping that isn’t actually present in the RAW data. If you shoot JPEG only, the histogram is final; if you shoot RAW, you have more latitude. For a full explanation of how JPEG settings influence the histogram (and why RAW shooters get more flexibility), see Section 4: The Nuance of RAW vs. JPEG Histograms.No Universal “Perfect” Histogram
Many beginners assume they should aim for a smooth, bell-curve-shaped histogram. In reality, there is no ideal histogram. The “right” shape depends on the scene and your intent.A night cityscape should naturally lean left.
A snowy mountain scene will lean right.
A silhouette may spike at both ends with little in the middle.
The histogram is a diagnostic tool, not a grading system.
Limited Dynamic Range
Your histogram can only show data within the 0–255 scale. If the dynamic range of the scene exceeds what your sensor can capture, the histogram can’t tell you how much is being lost — only that some is beyond the edges. This is why techniques like bracketing are necessary for extreme contrast situations.Color Channel Nuance
A single luminance histogram may look fine, while one or more of the RGB channels are actually clipping. For example, during a sunset, the red channel may hit 255 while green and blue remain intact. The result is banding or unnatural colors in post-processing. This is why advanced shooters rely heavily on RGB histograms for accuracy.Human Perception vs. Sensor Reality
The histogram measures light numerically, but photography is ultimately about perception. The camera might register tones as clipped or crushed, yet the human eye may not notice or even care in the final print. Conversely, an image that looks balanced on the histogram may feel dull or flat to the viewer. The histogram is a guide, not an artistic rulebook.
Bottom line: the histogram is an invaluable tool, but not infallible. Use it as one piece of your toolkit, alongside your eyes, your creative vision, and your post-processing workflow.
9. Practical Workflow Tips
The histogram is most useful when it becomes part of your shooting rhythm. Here are some ways to integrate it into your workflow without slowing yourself down:
Learn to anticipate the histogram
With practice, you’ll look at a scene and mentally predict what the histogram should look like. A bright beach scene? Expect data piled to the right. A moody portrait? Expect it leaning left. Training your eye to anticipate the histogram makes it a confirmation tool rather than a surprise.Use blinkies in combination with the histogram
Many cameras have a highlight warning mode (“blinkies”), which flashes areas of the frame where detail is blown out. The histogram shows you if clipping exists, while blinkies show you where. On some cameras, blinkies can even be displayed in live view before you press the shutter. This is tremendously helpful because you can adjust exposure on the fly, rather than taking a shot, checking the histogram afterward, and then retaking the photo. If your camera only shows blinkies on playback, you’ll need to shoot first and adjust after reviewing.Check during high-risk exposures, not every shot
Constantly checking the histogram can break your shooting flow. Instead, save it for tricky exposures: bright sun, mixed lighting, extreme contrast, or high-value shots where you can’t risk errors.Compare in post-processing
Software like Lightroom, Capture One, or DxO shows detailed histograms during editing. Compare these to what you saw in-camera. Over time, you’ll learn how your camera’s preview histograms relate to the actual RAW data, making your field checks more accurate.Customize picture profiles for RAW shooting
If your camera allows it, set a flat or neutral picture profile to make the in-camera JPEG preview (and thus the histogram) more faithful to your RAW file’s latitude. This minimizes false clipping warnings from contrast-heavy profiles.Bracket when in doubt
If the histogram is pressed against both ends and you’re unsure whether the highlights or shadows are more important, bracket. It’s faster to delete extra frames later than to lose irreplaceable detail.Use histograms as teaching tools
Reviewing histograms after a shoot can accelerate your growth. Compare them across different lighting conditions and subjects. Patterns will emerge — you’ll learn not only how exposure changes the histogram, but how your creative style shows up in the data.Remember, it’s a tool, not the law
A technically “ideal” histogram might produce a dull photo, while an unconventional one can create drama and mood. Use the histogram to safeguard critical detail, but don’t let it dictate every creative choice.
Bottom line: the histogram is there to help you make confident exposure decisions, not to box you in. The more you use it in real-world conditions, the more second nature it becomes.
Final Thoughts
The histogram isn’t just a graph — it’s a precise map of your exposure values across the 0–255 tonal scale. Once you know how to read it, you’re no longer guessing whether your highlights are safe or your shadows are too deep.
When I first started out, I struggled with underexposed and overexposed photos, and it was incredibly frustrating. As much as our cameras do a great job metering the scene, it’s ultimately the photographer who needs to control the narrative to achieve the best results. Things really started to click for me (pun intended) once I gained a firm grasp of the histogram.
That’s why I encourage new photographers to invest time in learning it. The histogram may look technical at first, but it’s really just telling you the story of your photo in numbers. Gain a solid foundation here, and you’ll elevate your photography to the next level — with both a safety net against mistakes and a powerful creative tool for shaping your images with intent.